№ 75 | Eco-ing Seattle, Mapping the Gen-AI Landscape, The Conflict House, Arduino’s Plug and Make Kit, and The WITHIN Leadership Toolkit

Eco-ing Seattle
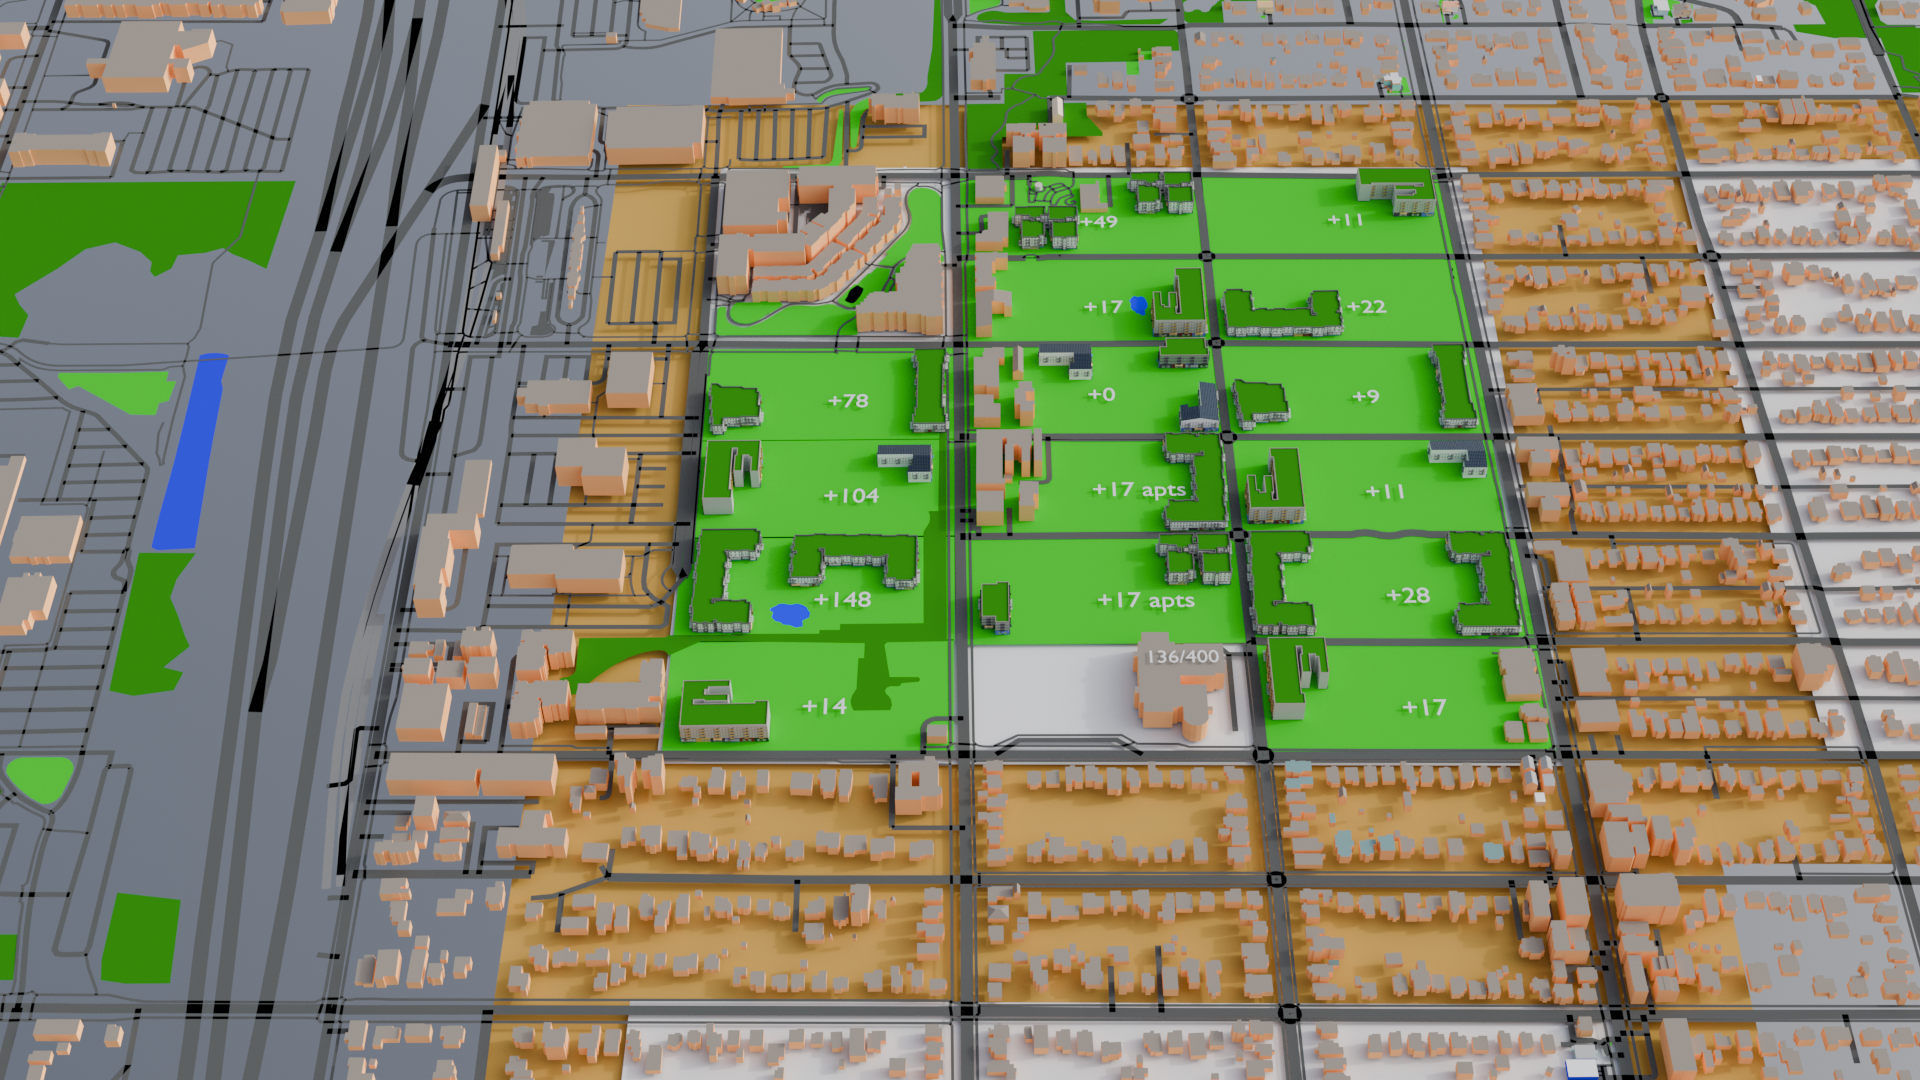
I’ve been enjoying this series reimagining an 18-block space Northgate, a Seattle neighborhood. Essentially, this a bit of speculative urban planning, based on ecological ideas from Edencity (a different project imagining “an eden-like city” with “economic + ecological abundance”). What struck me is this: It’s one thing to discuss and imagine—in the abstract—how you might do things differently; it feels different to point this imagination at a specific—real—area and then, ‘play around’ with some city design ideas. 🤔 👍
Mapping the Gen-AI Landscape
I love visual models that help orient us to and make sense of complicated topics. In this case, it’s a triangle diagram, mapping the landscape of gen-AI product user experience.
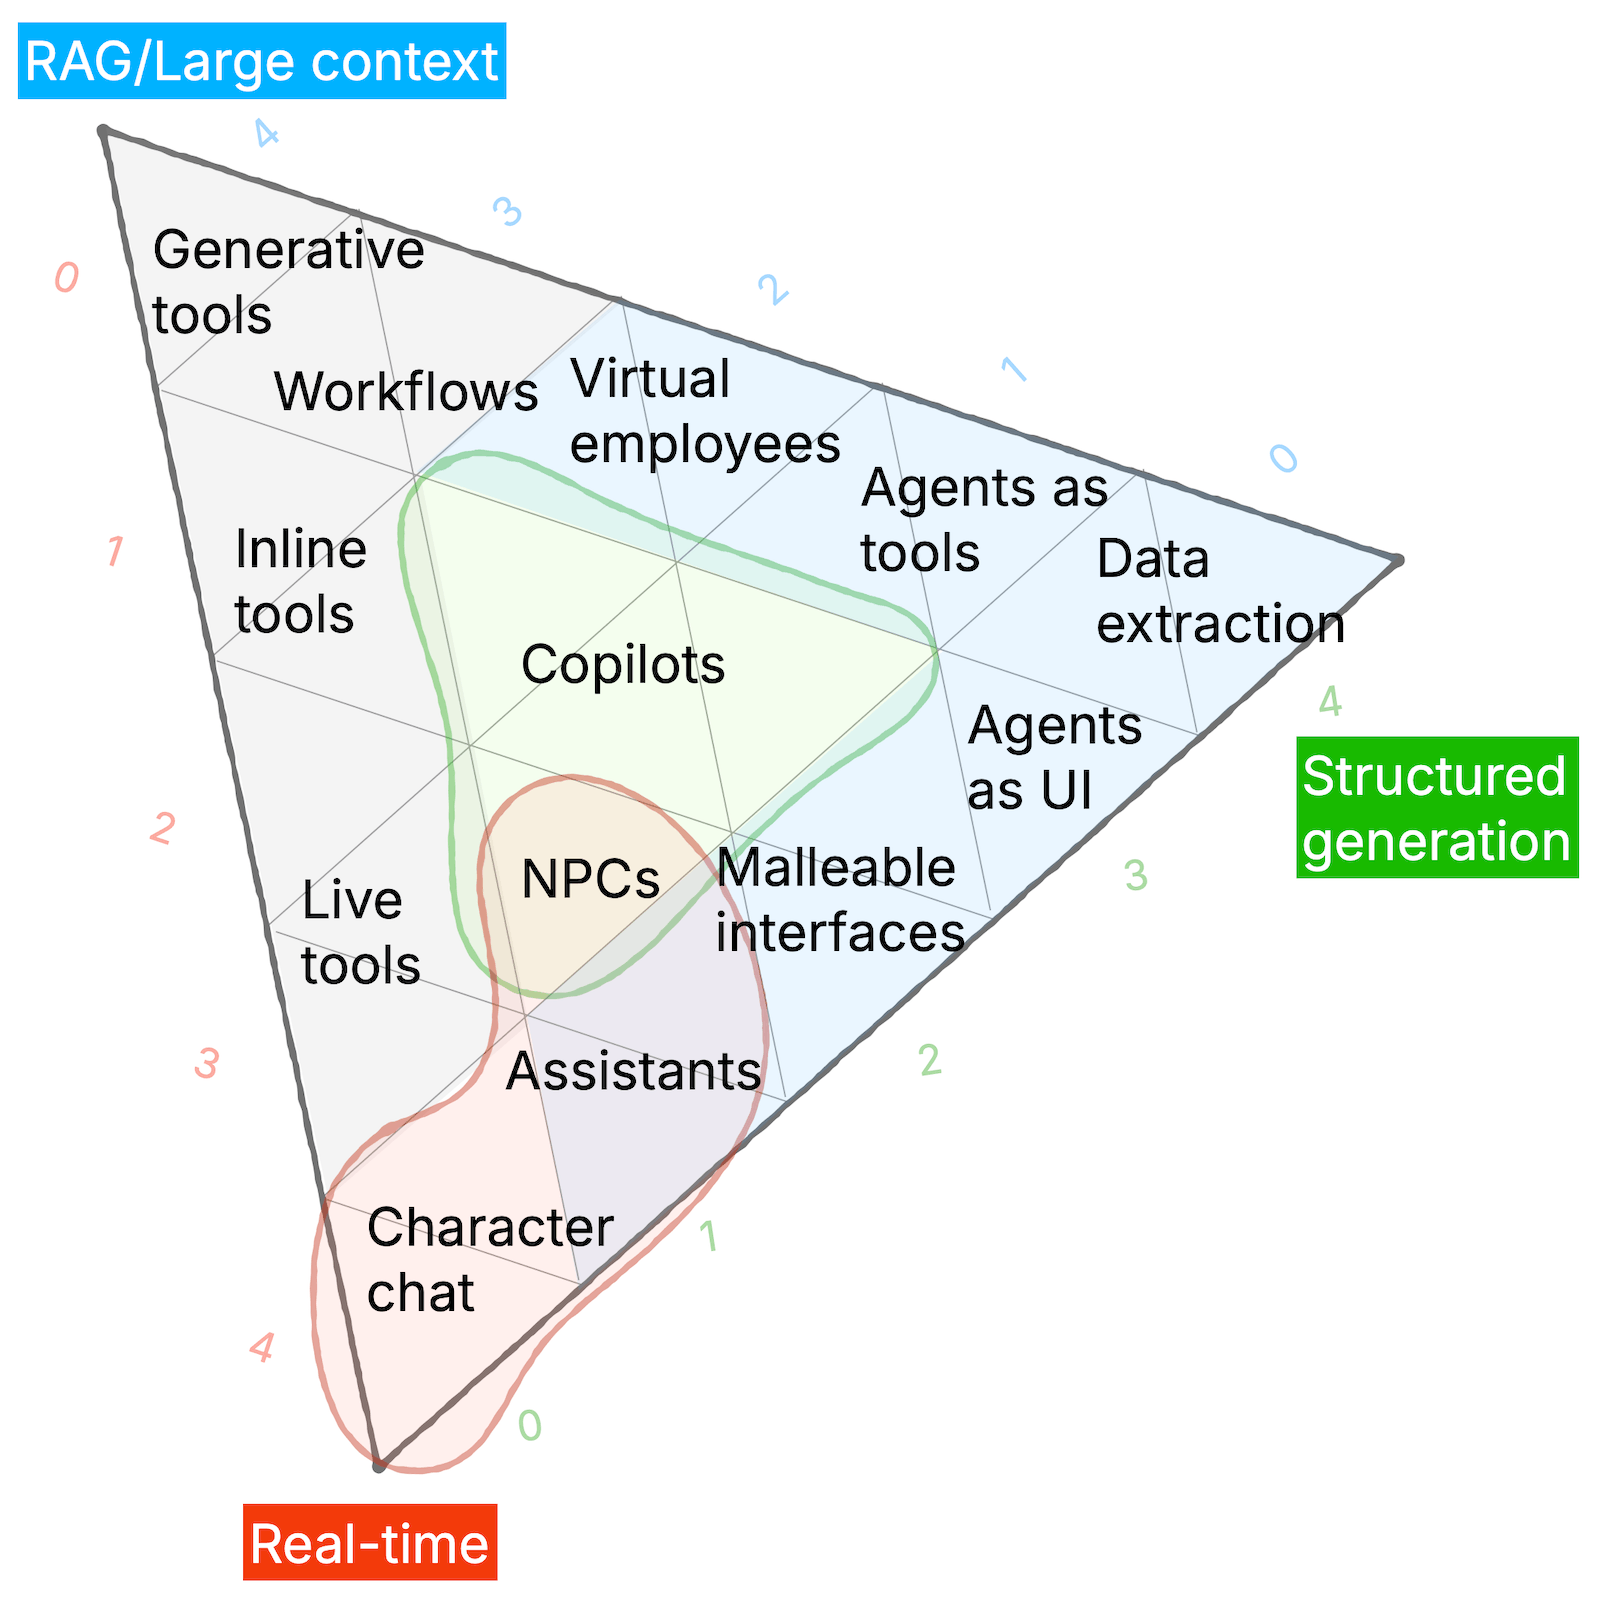
I also love how Matt Web describes how he’s using this map:
So it’s not a tool that gives me answers, it’s not that kind of map.
But it helps me communicate, and it’s a decent lens, and it’s a helpful framework in a workshop context.
Scaffolding for the imagination
“Scaffolding for the imagination.” 😍 I’m going to add that to my catchphrases!
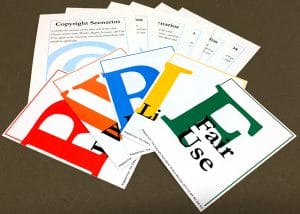
The Conflict House
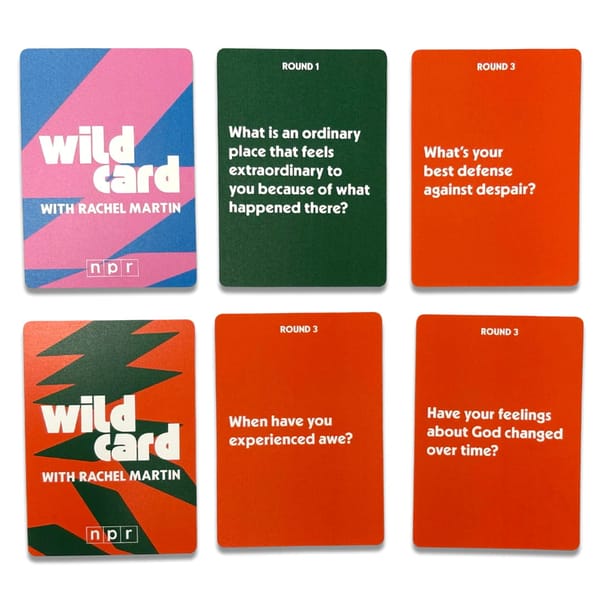
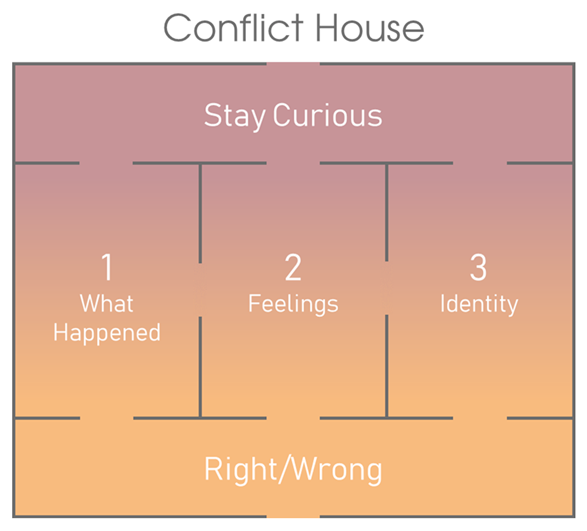
Ooh… A metaphor to reframe conflict. Think of a house, with three rooms: (1) What Happened (2) Feelings (3) Identity (all the healthy stuff we should explore and assess). You can walk through the front of the house—the place where things are Right or Wrong—or, as author Charles Lambdin describes, you can pretend you’re an investigative reporter.
Once you learn this secret, then you’ll realize that Conflict House has a back door as well… It is labeled “Stay Curious”, and when you enter through the back, everything inside seems…easier.
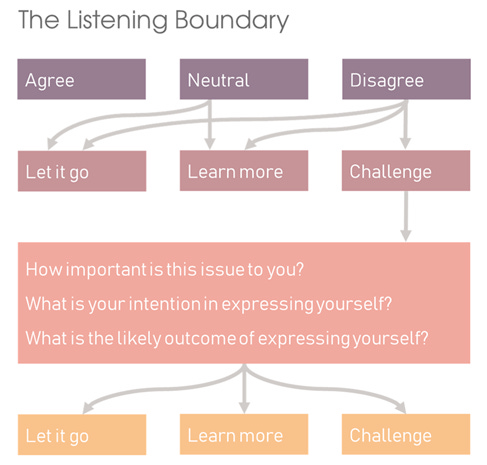
Nice! There’s other good stuff in this article, including this nice little flowchart to “strengthen your listening boundary.”
Arduino’s Plug and Make Kit
As a long time fan of LittleBits, SnapCircuits, LEGO Mindstorms, and similar toys playthings that make electronics more accessible—I’m all for Arduino’s Plug and Make Kit. Hacking, minus the solder!

And finally, it wouldn’t be a Thinking Things newsletter without mention of at least one card deck… 😉
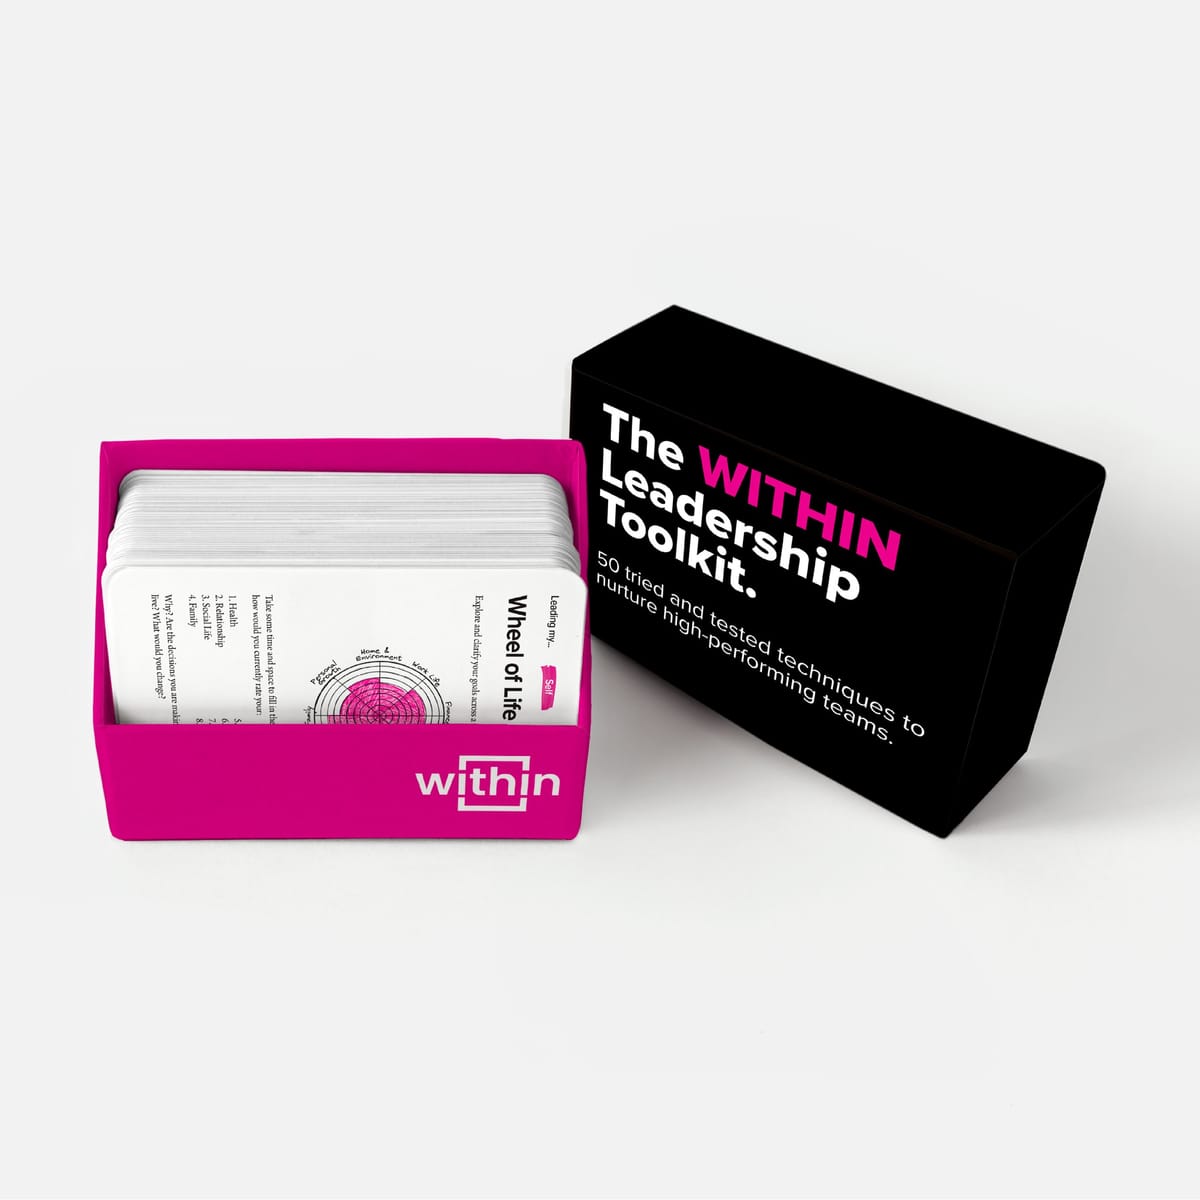
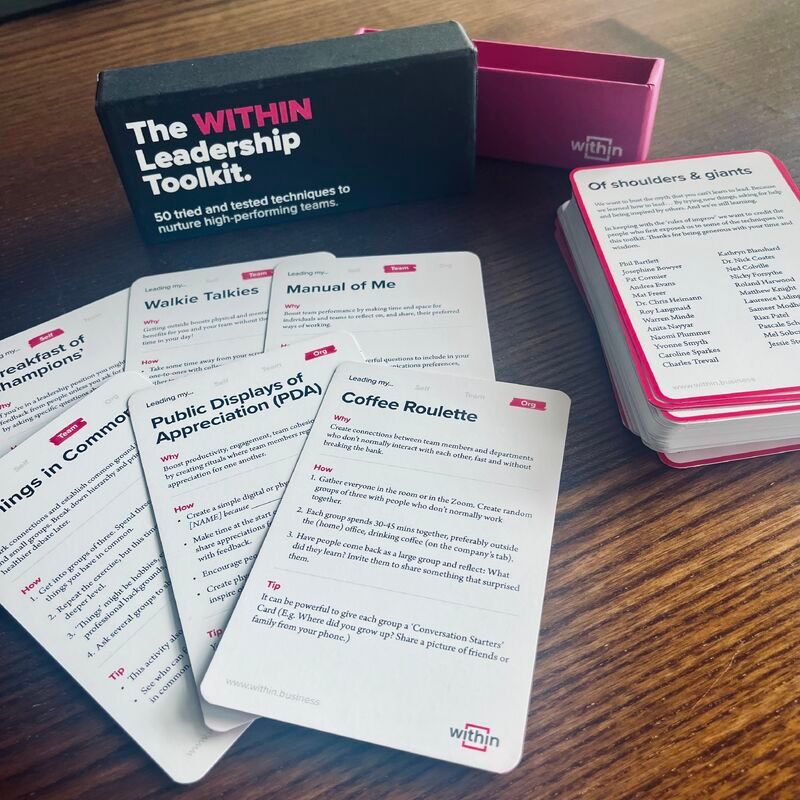
The WITHIN Leadership Toolkit
A card deck for team building? I’m in! The WITHIN Leadership Toolkit is a collection of… “50 tried and techniques to nurture high-performing teams - ideas and inspiration for strengthening relationships, increasing psychological safety, setting goals, giving feedback and getting to results.”
[NOTE: You can download a PDF version here.]
***Random BONUS #1: I'm fascinated by these Cyanometer and Sunset Postcards [see also John V Willshire’s Regenerative Design Field Kit].

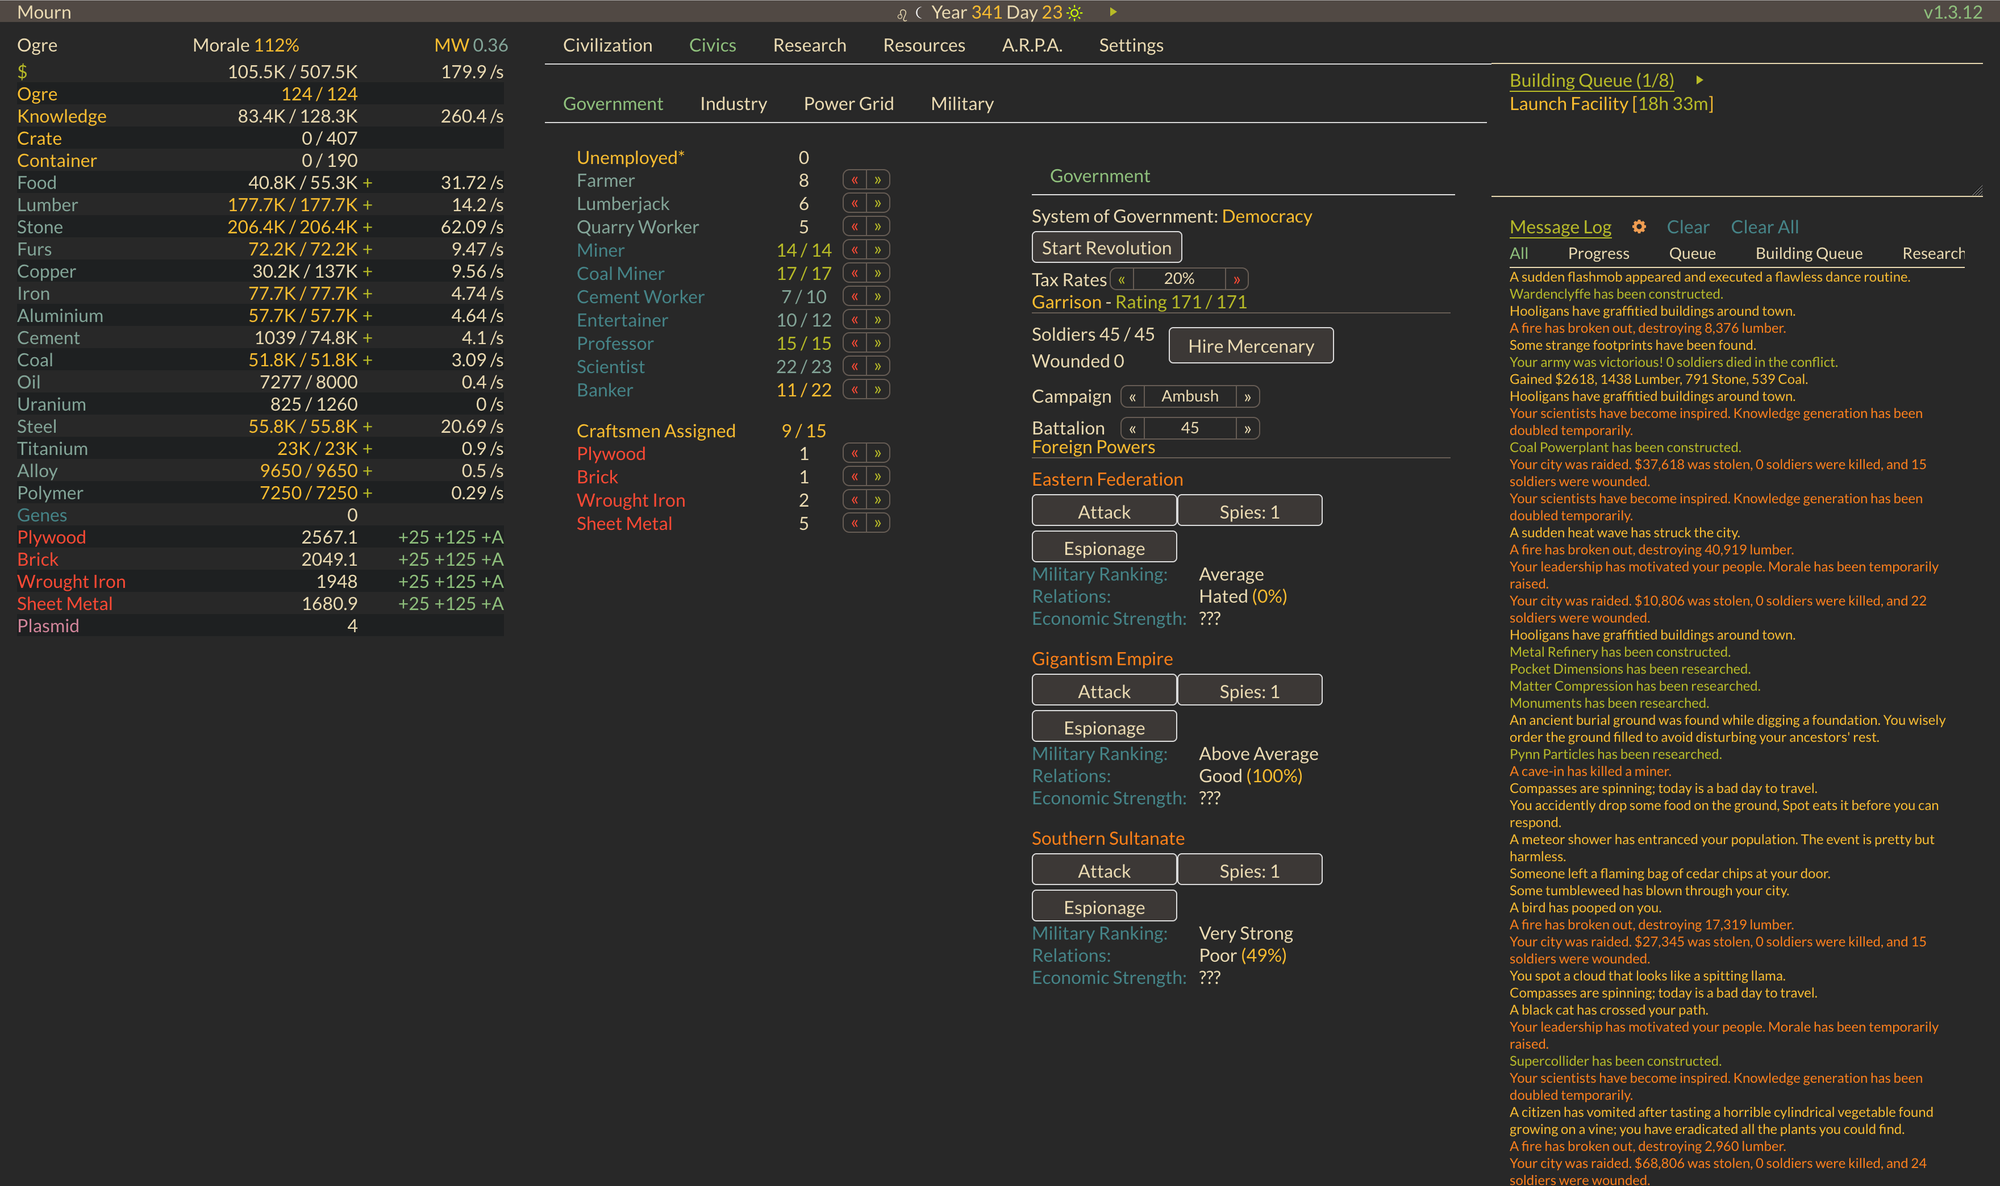
***Random BONUS #2: For reasons I can't explain—even to myself!—I’ve been kind of addicted to this ‘incremental’ game: Evolve.
How it started:
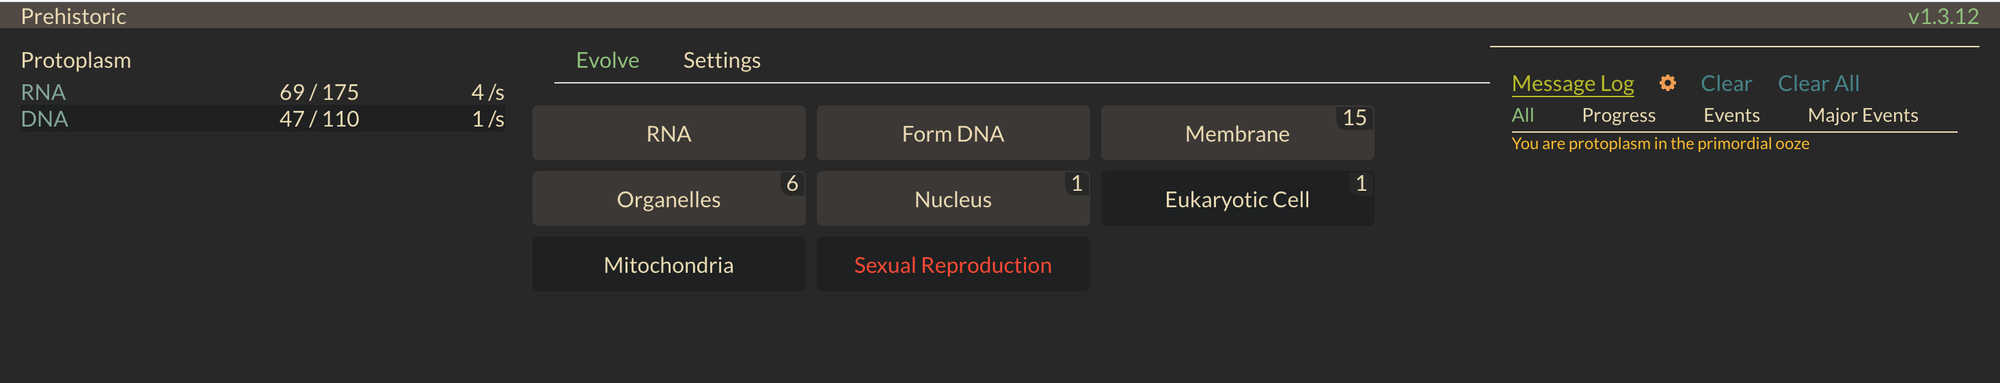
How it’s going: