№ 8 | Data Visualization Using… Light?!, From Notes to Comic Book Spread, The 2023 Better Conversations Calendar, “Disagree but Commit,” and a Meta-Learning Model

Data visualization using… light?!
This week, the Data Visualization Society released their long list of entries for the Information is Beautiful Awards. Among the many entries, was that rather unique—and brilliant—gem: A visualization of "books bought and read over the last five years." Here's a teaser image:

** SIDENOTE: As someone who accumulates lots (and lots!) of books, many that I've not read… yet, I take offense at the “Am I a reader or just another hoarder?” comment. It's a false dichotomy, right? RIGHT?!
From notes to comic book spread
I love a peek into other people's creative process. Here's a glimpse at how Nick Sousanis brings his *amazing* graphic illustrations to life.
In case of interest: A narrated look at my lengthy creative process from sketched notes & research to thumbnail breakdowns to final drawings in making two comic book spreads. I documented it a year ago, but finally got around to putting it in slides. #nostos #unflattening 2 pic.twitter.com/5YzDRe59jf
— Nick Sousanis @nsousanis on all the socials fwiw (@Nsousanis) October 7, 2022
The 2023 Better Conversations Calendar
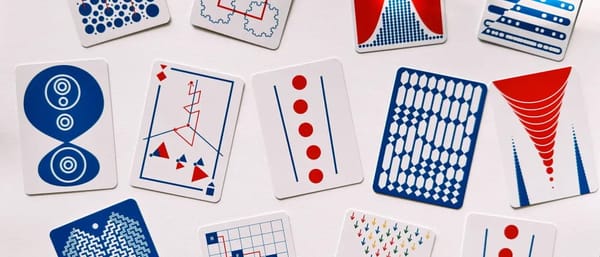
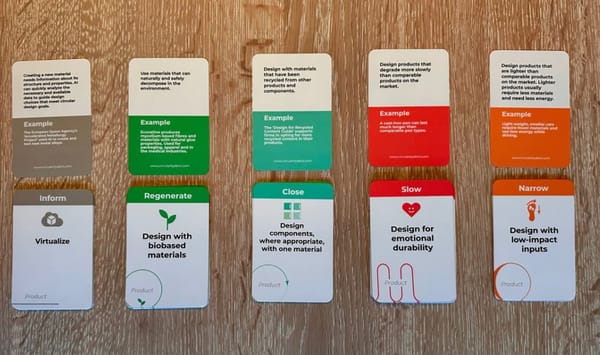
Here's a thing to think with… the The 2023 Better Conversations Calendar from Kat Vellos! From the images, this looks like an interesting bank of questions to go along with each month.

“Disagree but commit”
Things that make you think… Here's something from Eileen Wang that gave me pause:
I always had a problem with the phrase “disagree but commit”.
Because I don’t think you can actually achieve that without established trust in the team. It will always be hard for stakeholders to move forward if you don’t intentionally create a space of psychological safety.
My go to tool in situations like these is Fist to Five. But, after reading through the responses, I started reconsidering the more complex social dynamics that might sit behinds someone's 1 finger (no, not that finger!) response…
Learning models, FTW!
I love a good concept model. Here's a big picture visual from Efrat Furst that tries to “depict the interplay between the basic learning process, the related research fields, and some goals.” (More context in the twitter thread)


